
One thing civil servants learn is to write things down. Here is Academy of Medical Sciences 14 July report commissioned by the UK Chief Scientific Adviser. For the record.
It sets out what was known in July, and clearly sets out what the Government needed to do at the time. Straight off the bat, we have the executive summary.
Line one: “July and August must be a period of intense preparation for our reasonable worst-case scenario for health in the winter that we set out in this report, including a resurgence of COVID-19, which might be greater than that seen in the spring.”
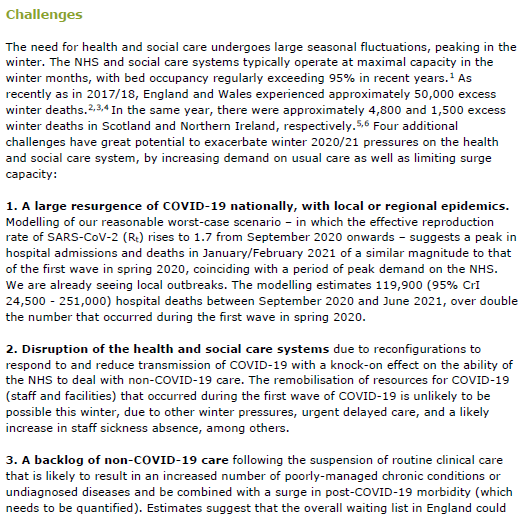
Here are the challenges expected under a reasonable worst case scenario:
1. A large resurgence of COVID-19 nationally, with local or regional epidemics
2. Disruption of the health and social care systems
3. A backlog of non-COVID-19 care
4. A possible influenza epidemic
And sets out what we should have done:
– public engagement
– extensive public information campaign
– tailoring guidance –
and…
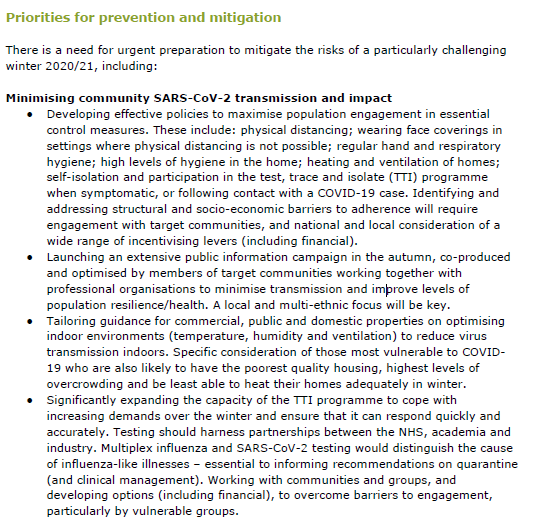
Here we go: “Significantly expanding the capacity of the TTI programme to cope with increasing demands over the winter and ensure that it can respond quickly and accurately.”
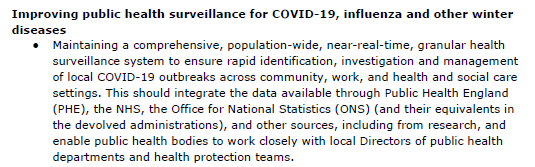
Improving public health surveillance: “Maintaining a comprehensive, population-wide, near-real-time, granular health surveillance system to ensure rapid identification, investigation and management of local COVID-19 outbreaks across community, work, and health and social care”.
But why does this matter? What would happen if we got this wrong? “Even scenarios with Rt in the 1.1-1-5 are likely to stretch the NHS”

So, what was R? The UK Government estimated it to be 1.0-1.2 (so say 1.1). That was on 11 September. https://gov.uk/guidance/the-r
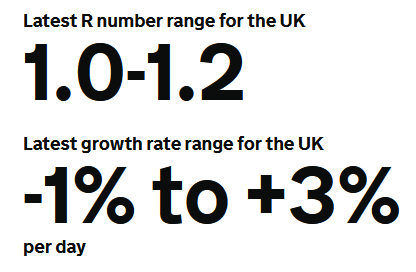
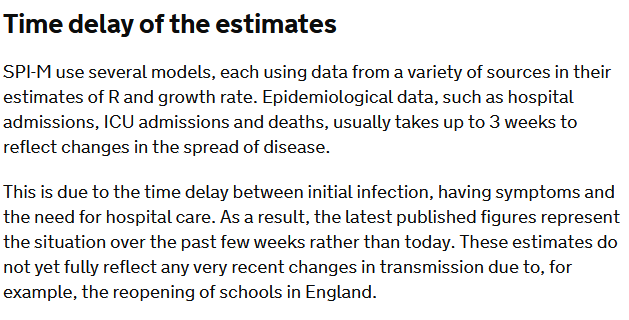
But look at the caveat that goes with that estimate “The latest published figures represent the situation over the past few weeks rather than today. These estimates do not yet fully reflect any very recent changes in transmission due to, for example, the reopening of schools…”
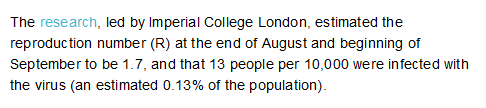
The REACT survey estimated R to be 1.7 https://imperial.ac.uk/news/203873/largest-covid-19-testing-study-shows-cases/
Now re-read the @uksciencechief‘s report “Even scenarios with Rt in the 1.1-1-5 are likely to stretch the NHS”
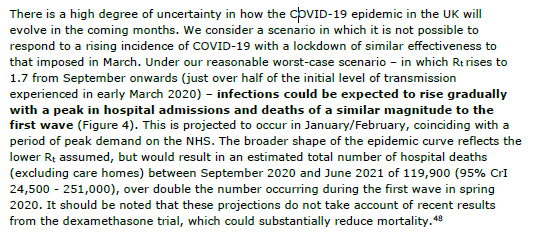
But what is this reasonable worst case scenario? Back to the report. Oh, and there’s talk of R being 1.7 again:
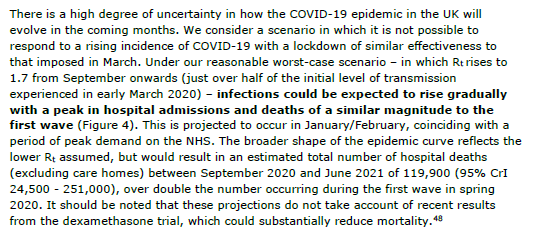
“infections could be expected to rise gradually with a peak in hospital admissions and deaths of a similar magnitude to the first wave (Figure 4). This is projected to occur in January/February, coinciding with a period of peak demand on the NHS….
“The broader shape of the epidemic curve reflects the lower Rt assumed, but would result in an estimated total number of hospital deaths (excl. care homes) between September 2020 and June 2021 of 119,900 … over double the number occurring during the first wave in spring 2020
Here is the full report. It’s worth a read. And this is what I wrote at the time of publication: ‘don’t say we weren’t warned’.