Why The Mayor of Houston Was Right to Not Evacuate the City

Right now, Houston is going through one of the most severe storms ever to hit the USA.  The main conversation on today’s news was whether the Mayor (who has authority to do such things) should have evacuated the City prior to the arrival of Hurricane Harvey.

For a start, NOAA did not forecast a direct hit on the City.  But it was forecast that potentially devastating rains were on the way.

Houston has been here before, of course, in 2005 when the then Mayor did order that the city be evacuated.  And around 100 died, as a result of the gridlock and heat.

But let’s think about what an uncontrolled evacuation of Houston would mean.

This is the map of the Houston highway system.

And here is is on Google maps.


While there is, of course, a Houston evacuation plan, assuming you want to avoid the Gulf of Mexico, the main routes are via the north and west: I69 to the north-east, I45 to the north, US Route 290 to the north-west, and I10 to the west.

Now let’s consider the capacity of these roads.  The capacity of roads in the US is given by the Department of Transportation’s Highway Capacity Manual.  While there is a whole science devoted to calculating freeway flow measurements, you need to take into account not only the capacity of the road (the number of cars), but also their speed.  Combining these gives us a flow rate, i.e. the number of cars that will pass a point in a particular length of time.  We can look at the academic literature to see what this is.  Dixit and Wolshon (2014) have a nice study where they looked at maximum evacuation flow rates.  Their Table 2 shows the empirical data, but it’s around 1,000 vehicles per hour per lane.  Assuming the Houston metro system evacuation routes of the north and west are around 4 x 4 lanes.  Give a factor of 1.5 for contraflows, and you have around 25 lanes.  So that’s 25 x 1000 = 25,000 vehicles per hour.  And let’s assume an occupancy of 4 passengers per vehicle (i.e. most would evacuate by car).  So that’s 100,000 passengers per hour.

The problem with Houston is that it’s the USA’s fourth largest city.  And that means it’s big.  It (Greater Houston) has a population of 6.5 million.  So that means 6.5 million / 100,000 = 65 hours.  Non stop, day and night.  Without accidents.  A very bold move for a hurricane that was not due to hit directly.

And tropical storm watches are only typically issued 48 hours before winds are due to strike.

By not evacuating, resources are kept in Houston rather than being disseminated across the locations of incidents caused by evacuating traffic.

The real test however comes in the days and months ahead, where the process of rescue, recovery, and rebuilding is critical.

References

Dixit, V. and Wolshon, B. (2014) ‘Evacuation Traffic Dynamics’, Transportation Research Part C, 49, 114-125
 

The Most Competitive Airline Routes in the World

I am using airline data to construct a network of competition in the airline industry.  As part of this, I am listing the routes that are the most competitive – not necessarily the ones that have the most flights, but the ones that have the most competitors.

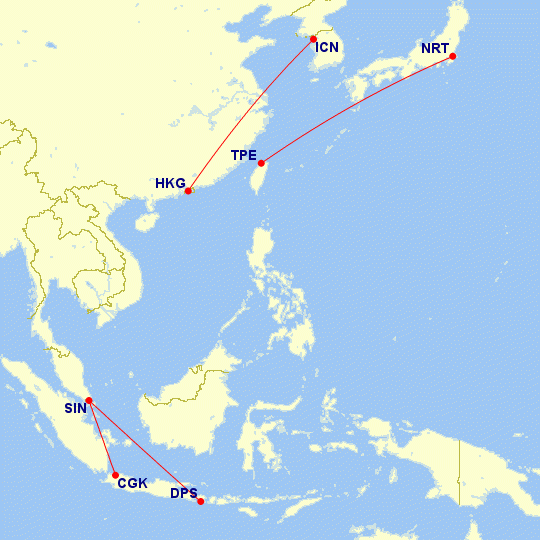
And here they are

Map generated from GCMap.com

HKG-ICN  Hong Kong – Incheon, Seoul (South Korea)

Not shown: EastarJet

TPE-NRT  Taipei (Taiwan) – Narita, Tokyo (Japan)

Not shown: Vanilla Air, Tiger Air, Scoot, Transasia

SIN-CGK   Singapore – Jakarta (Indonesia)

Not shown: Indonesian Air Asia, Scoot, JetStar Asia

SIN-DPS   Singapore – Denpasar, Bali (Indonesia)

Not shown: Qantas, Qatar, Indonesia Air Asia, Scoot (nb JetStar and JetStar Asia are different airlines)

Please note that these data are a few years old, are preliminary and not completely accurate, and airlines come and go on such competitive routes.

Two Funded PhD Studentships in Agent-Based Modelling at Loughborough University School of Business and Economics [applications now closed]

I am looking for high quality, numerate, candidates to fill these exciting PhD studentships with me as a (co-) supervisor at Loughborough’s School of Business and Economics.  Please note that this post has been updated with new links (in blue, below).

The first is modelling dynamic responses to dynamic threats; the second is using analytics in traditional industries.  Please see the links below for further details and how to apply.  Note that for further information, you will need to click on the blue links below.

Modelling Dynamic Responses to Dynamic Threats (with Professor Gilberto Montibeller)

One of the most challenging issues for policy makers dealing with bio-security threats is their dynamic nature: diseases may spread quickly and deadly among vulnerable populations and pandemics may cause many casualties.

Finding the appropriate response to threats is a major challenge.  Whilst models exist for understanding of the dynamics of the threats themselves, responses can be largely ad-hoc or ‘firefighting’.  The aim of this research is to produce robust responses for dynamic threats.

The research will build up as follows, from low to high complexity: static responses to static threats; static responses to dynamic threats; dynamic responses to static threats; and dynamic responses to dynamic threats.

We will use a variety of methods to define the best response: cellular automata, network analysis, spatial modelling, agent-based modelling, and the generation of dynamic fitness landscapes.

This PhD studentship is most suitable for candidates with a background in a quantitative discipline such as management science, operations research, engineering, physics and other natural sciences.

Business Analytics for Public Services and Regulated Industries: New Techniques for Analytics-Driven Decision Making in Traditional Industries (with Dr Maria Neiswand and Professor David Saal)

The rise of business analytics has given rise to enormous opportunities within the private sector, but these benefits have yet to be fully realized in public services and regulated industries such as energy, water, and transportation networks. Conversely, governments are mandating collection of data by installing smart metering devices. This gives rise to the need for innovative ways of thinking in industries that are still largely based on traditional economic thinking involving conventional assumptions on optimization and behaviour.

As an example, the energy sector is characterised by strongly defined market structures with incumbents and an ultimate need for energy network security, which not only prevents the quick adoption of technical changes but also translates into regulatory outcomes, such as price caps.

This exciting PhD opportunity will integrate theoretical and empirical approaches and spans two strengths of Loughborough’s School of Business and Economics: microeconomics and particularly rigorous analysis of the determinants of productivity and performance (including cost modelling) and management science (including simulation and network analysis).

We are therefore seeking a student with a quantitative background (whether in economics, management science, engineering, physics or other natural sciences). A willingness to learn new techniques such as, cost modelling, performance measurement, agent-based modelling and network analysis is desired.